Case Study:
Indicators of Success
for Benbow Historic Inn’s Website Redesign
We performed a website redesign for Benbow Historic Inn which launched summer of this year. The new website design had an improved design, expanded content, new photography by Michelle Chaplow, and an optimized user-experience. What we discovered was how all this work had a significantly positive impact on website traffic, user engagement, and especially revenue for Benbow Inn!
Here Are 8 Indicators of Success
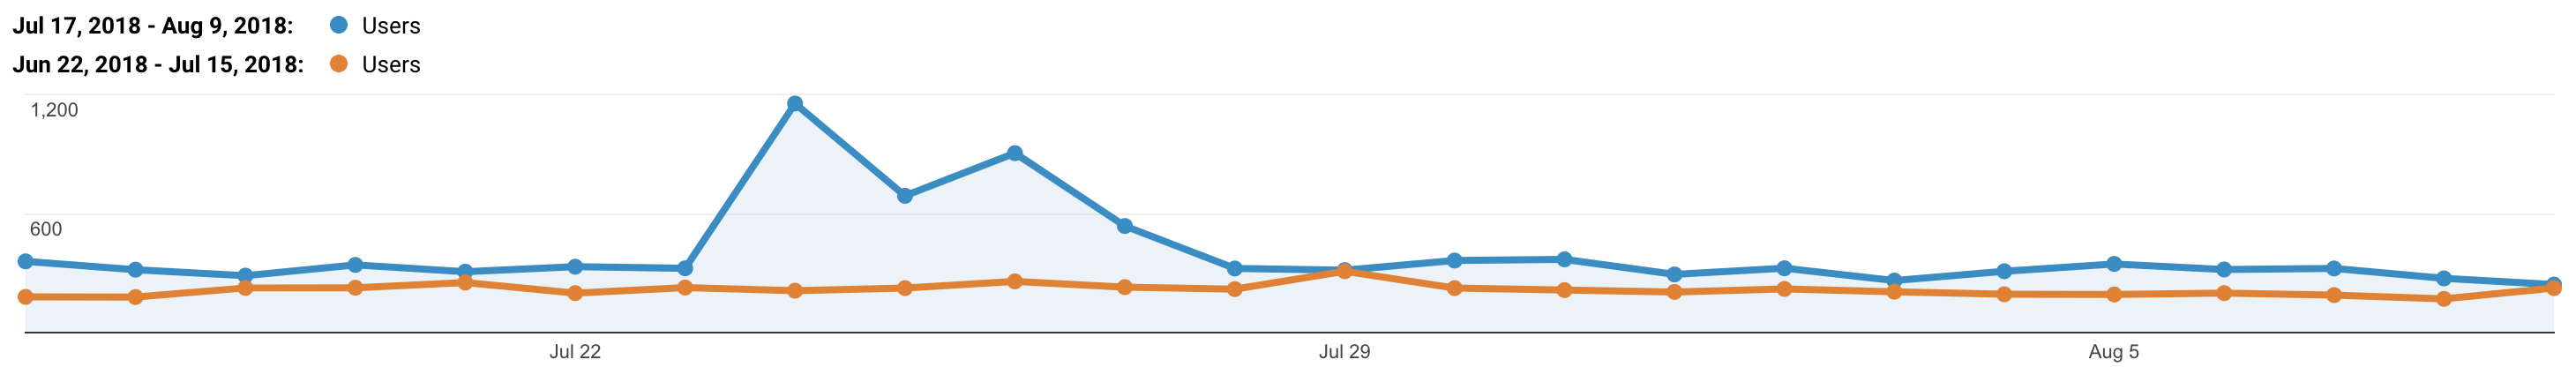
We launched the website on July 16, 2018. For the following points below we’ll be comparing July 17th – August 9th to June 22th – July 15th. This reflects data for a 30 day period before and after the website launched.
1. Revenue increased year over year by 37%.
Looking at data directly generated from the booking engine we saw a direct increase in bookings from the website. When we compared 2018 to 2017 for July 16 – October 14 this is what we found:
- 25% increase year over year for reservations generated.
- 37% increase year over year for revenue generated.
- 12% increase in average daily rate.
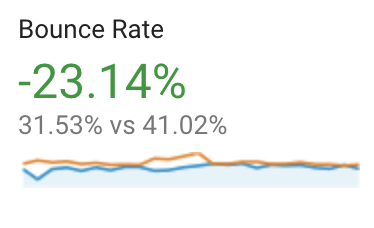
2. Bounce rate 23% improved! Now down to 32%.
A bounce rate is when someone visits the website, then leaves. They don’t click on other pages or engage. A typical bounce rate is somewhere between 20 and 40%.
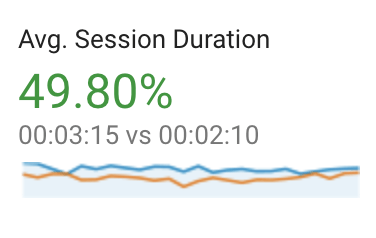
3. Average duration 50% improved! Now 3 minutes and 15 seconds.
The average amount of time people spent on the website went from 2:10 to 3:15. This means users spent 50% more time on the website than before—likely to view all the photography! A typical duration average is 1–1:30.
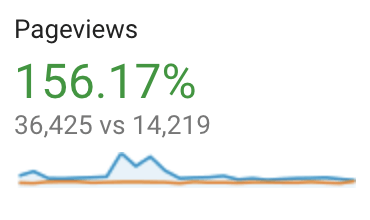
4. On average 156% more pages viewed.
On average 14,000 web pages were viewed. This went up to 36,000 pages after the website launched.
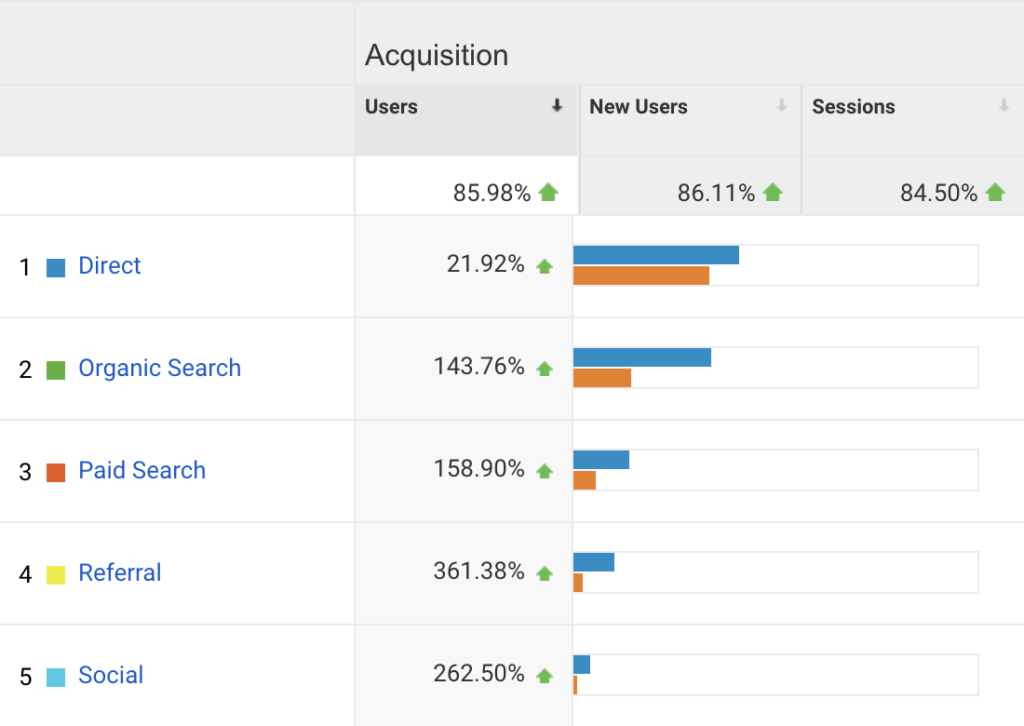
5. Referrals via organic search results Improved 143%.
When users Google various terms—Benbow’s website came up in search results for 1,728 more users than before the site launched.
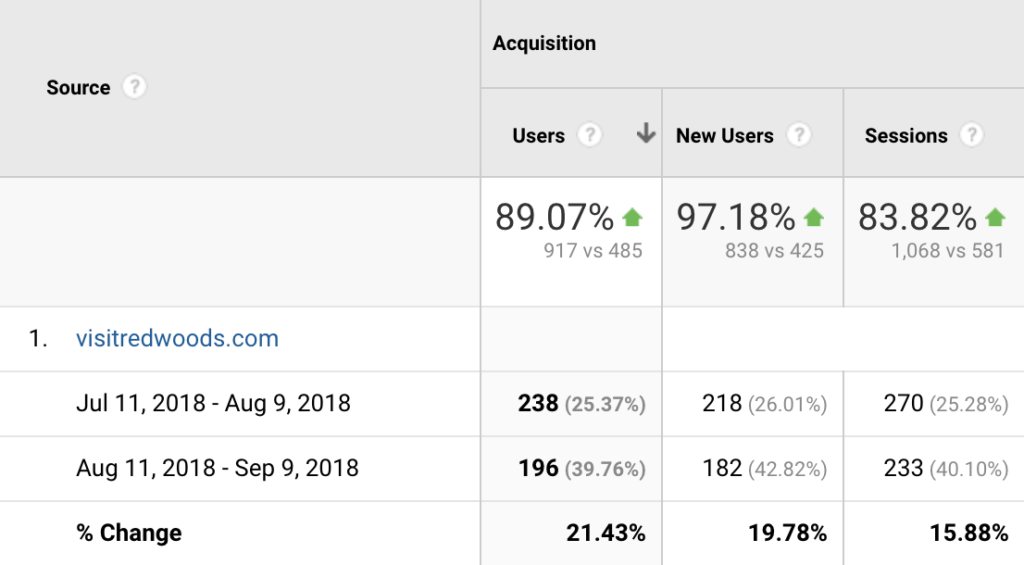
6. Photos added to visitredwoods.com increased referral traffic by 20%.
New photography was added to our listings on visitredwoods.com and it increased our referral traffic from that website increased significantly. The photos were changed August 10th. By comparing before and after this time (Jul 11–Aug 9 vs Aug 11–Sep 9) we can clearly see an increase in referral traffic.
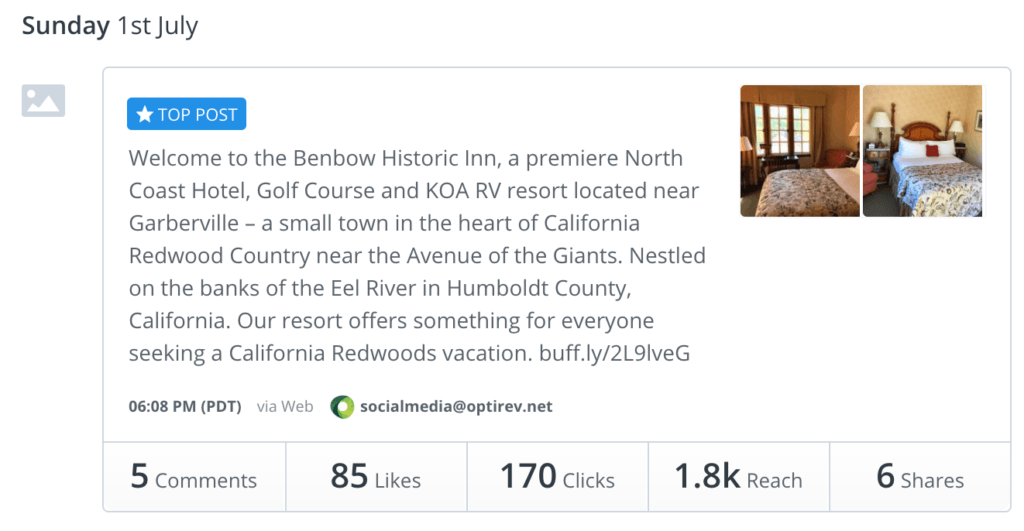
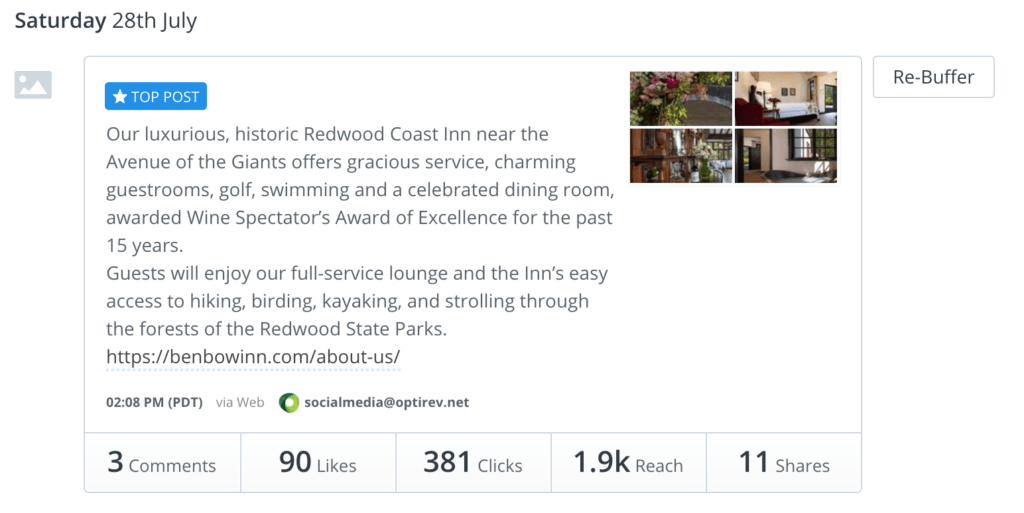
7. Click through rate on Facebook increased 45% for posts using new photos.
Once we started doing social media posts with the high-quality photographs, users interacted more with posts. We saw a 45% increase in click through rate, and almost twice the amount of shares.
8. Positive feedback received on social media.
We received some of the following positive remarks regarding the website redesign and new photography.
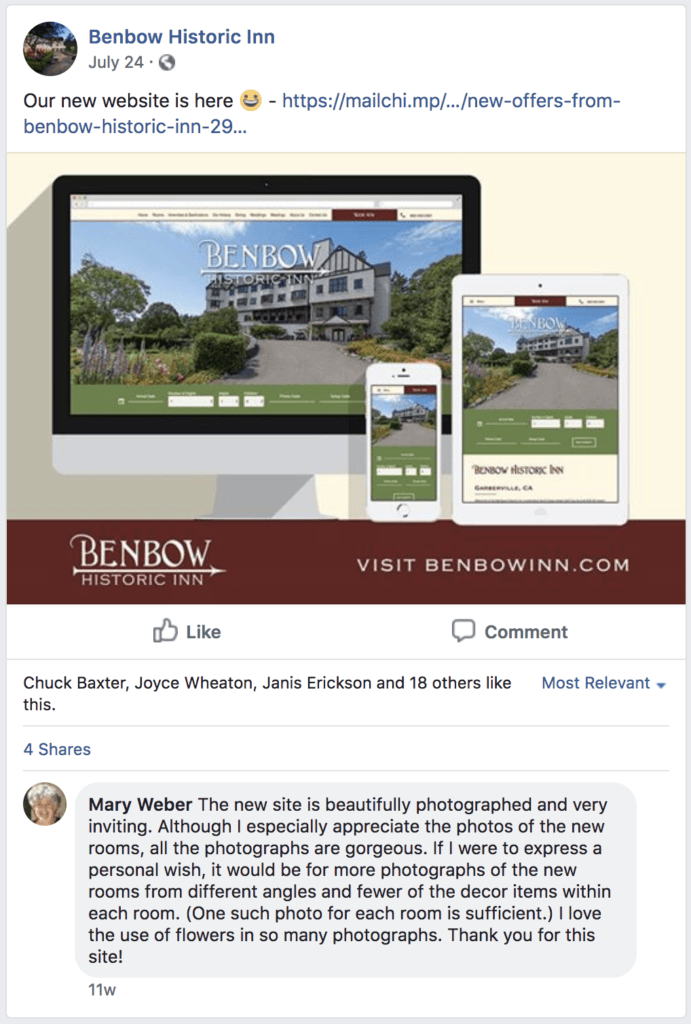
The new site is beautifully photographed and very inviting. Although I especially appreciate the photos of the new rooms, all the photographs are gorgeous. If I were to express a personal wish, it would be for more photographs of the new rooms from different angles and fewer of the decor items within each room. (One such photo for each room is sufficient.) I love the use of flowers in so many photographs. Thank you for this site!
— Mary Weber,
Comment via Facebook
Conclusions
After we launched the new website design the Benbow Historic Inn received a noticeable increase in revenue, website traffic, and reach with their online presence. The new photography made a huge impact on drawing users to the website and “selling” Benbow Inn to guests. Selling this experience happened through a mobile-responsive, search-engine friendly website with beautiful photography and well organized content. This case study is proof that effort invested in the subjective elements of your website can make a huge difference in marketing your business online.

